Lifetime Value (LTV)

Most Product teams track retention. Many track churn. Fewer track Lifetime Value (LTV), and those who do often treat it as a finance metric they glance at in quarterly reviews. That’s a missed opportunity. LTV is the metric that tells Product Managers whether the things they’re building actually generate durable value, or just short-term engagement spikes that feel good in a sprint review but evaporate within months. When a team can’t articulate the lifetime value of its customers, it’s flying blind on prioritization, pricing, and strategic investment. The metric belongs in the Product team’s toolkit, not locked inside a finance spreadsheet.
What is Lifetime Value (LTV)?
Lifetime Value (LTV) is the total revenue a business can expect to earn from a single customer account across the entire duration of that customer’s relationship with the product. It factors in how much a customer pays, how often, and how long they stay. LTV helps Product teams, finance leaders, and growth teams understand whether customer acquisition and retention efforts are generating sustainable returns.
LTV is sometimes referred to as Customer Lifetime Value (CLV or CLTV). The terms are interchangeable, though “LTV” is the more common shorthand in SaaS and product-led organizations. Regardless of the label, the concept addresses the same fundamental question: how much is a customer worth over time?
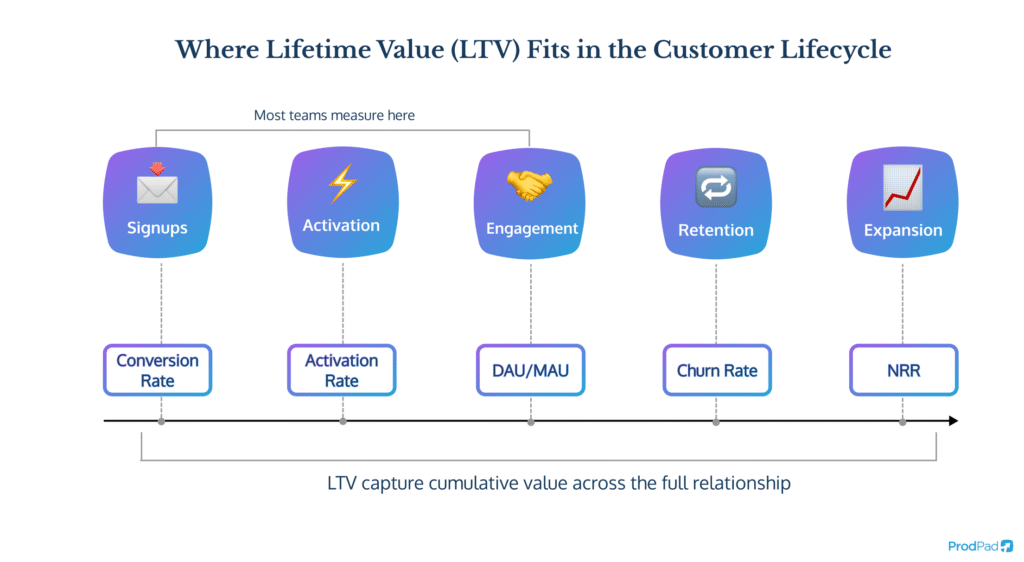
The reason LTV matters so much in product work is that it shifts decision-making from transactional thinking to relationship thinking. A team focused on conversion rates alone might optimize for signups without considering whether those users stick around. A team focused on LTV asks different questions entirely: which customer segments generate the most long-term value? Which product investments improve retention across those segments? Where are we spending acquisition budget on customers who churn within 90 days?
LTV also creates a shared language between Product, Marketing, Sales, and Finance. It’s one of the few metrics that everyone in the organization can rally around because it captures the full arc of the customer relationship, from first interaction to eventual departure.
Why Does Lifetime Value (LTV) Matter for Product Teams?
Product Managers often inherit a dashboard full of lagging indicators. Monthly active users, feature adoption rates, NPS scores. These metrics all have their place, but none of them answer the question that executives and investors care about most: are customers generating more value than it costs to acquire and serve them?
LTV answers that question directly. And it does more than justify marketing spend. It shapes product strategy.
Lifetime Value (LTV) as a Prioritization Input
When Product teams evaluate what to build next, they often weigh impact against effort. Frameworks like RICE scoring and ICE scoring formalize this. But “impact” is often measured in terms of reach or engagement. LTV adds a financial dimension. A feature that improves retention for high-LTV customer segments by even a small percentage can be worth more than a flashy new capability that attracts a wave of low-value signups.
This is where LTV intersects with OKRs. If a team’s objective is to increase net revenue retention, LTV becomes one of the clearest signals of whether roadmap investments are working. Connecting OKRs to LTV means the team isn’t just shipping features; it’s shipping outcomes that move the business.
Lifetime Value (LTV) Informs Acquisition Strategy
The relationship between LTV and Customer Acquisition Cost (CAC) is one of the most widely cited benchmarks in SaaS. The standard target is an LTV:CAC ratio of roughly 3:1, meaning the revenue generated by a customer over their lifetime should be at least three times the cost of acquiring them. A ratio below 1:1 signals an unsustainable model. A ratio above 5:1 may indicate the company is under-investing in growth.
Product teams often sit outside this conversation, but they shouldn’t. Product decisions directly influence both sides of the ratio. A smoother onboarding experience improves activation rates, which increases the likelihood that a customer reaches their first “wow moment” and sticks around long enough to generate meaningful LTV. A better feedback loop between customers and the roadmap reduces churn, which extends customer lifetimes.
Lifetime Value (LTV) Shapes Pricing and Packaging
Pricing decisions are product decisions, even when Finance or Sales owns the final call. Understanding LTV by segment helps teams identify where pricing is leaving money on the table or where a plan tier is misaligned with the value customers receive.
If enterprise customers have an LTV five times higher than SMB customers, but the enterprise plan is only priced 50% higher, there’s a gap. Conversely, if a particular customer cohort churns rapidly despite paying a premium, the product may not be delivering the value that the pricing implies.
Want to go deeper on the metrics that matter for Product teams? Download ProdPad’s free eBook, The Complete List of Product Management KPIs, to see where LTV fits alongside 33 other essential product metrics.
How Do You Calculate Lifetime Value (LTV)?
There’s no single formula for LTV. The right approach depends on your business model, data maturity, and how precise you need the number to be. Most SaaS and subscription businesses use one of two methods.
The Basic Lifetime Value (LTV) Formula
The simplest calculation multiplies average revenue per user by the average customer lifespan:
LTV = Average Revenue Per User (ARPU) x Average Customer Lifespan
If your average customer pays $100 per month and stays for 24 months, your LTV is $2,400. Simple enough. This is a useful starting point and gives leadership a ballpark figure to work with.
A slightly more refined version factors in gross margin:
LTV = (ARPU x Gross Margin %) / Customer Churn Rate
This approach accounts for the cost of serving the customer and uses churn rate rather than raw lifespan, which can be easier to calculate when you have reliable monthly churn data. If your ARPU is $100, gross margin is 80%, and monthly churn is 5%, the calculation looks like this: ($100 x 0.80) / 0.05 = $1,600.
The Cohort-Based Lifetime Value (LTV) Method
The basic formula assumes linear churn, meaning customers leave at a steady rate over time. In reality, most products see heavy early churn that tapers off as the remaining customers become more embedded. A cohort-based approach tracks actual revenue from specific groups of customers (grouped by signup month, acquisition channel, plan type, or segment) over time, producing a more accurate picture.
Cohort analysis is particularly useful because it reveals patterns the basic formula hides. You might discover that customers acquired through organic search have 40% higher LTV than those acquired through paid campaigns. Or that customers who complete onboarding within the first week have double the lifetime value of those who take a month. These insights are directly actionable for Product teams.
What Lifetime Value (LTV) Inputs Product Teams Can Influence
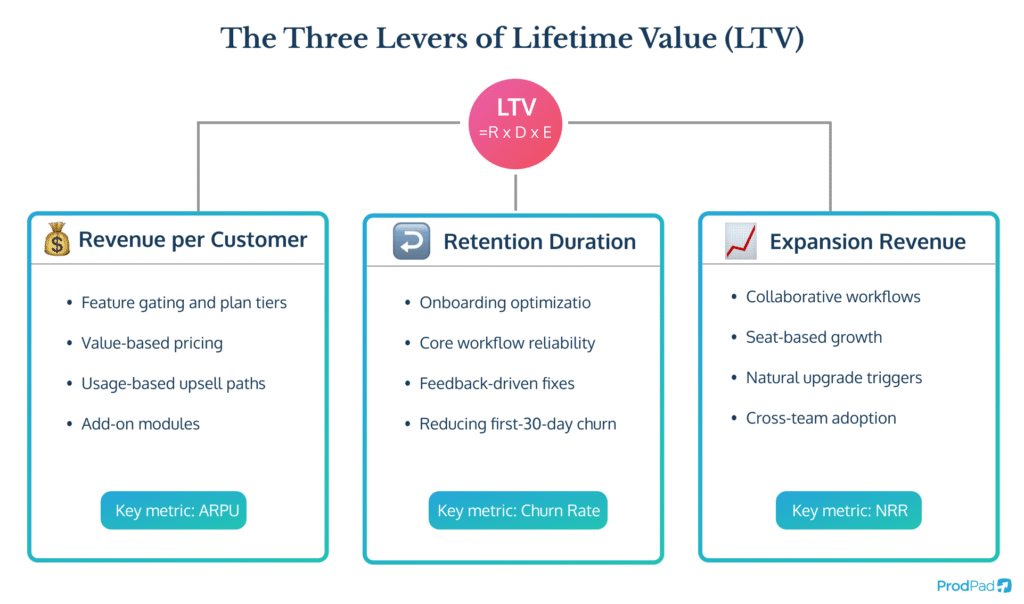
The components of LTV break down into three levers:
Revenue per customer. Product teams influence this through feature gating, plan structure, and expansion pathways. Building capabilities that naturally drive customers toward higher-tier plans increases ARPU without aggressive upselling.
Retention duration. This is where product work has the most direct impact. Every improvement to usability, reliability, and core value delivery extends the average customer lifespan. Teams that focus on reducing friction in the first 30 days of product usage often see the largest improvements here, because early churn is where most SaaS businesses lose customers.
Expansion revenue. Customers who grow their usage over time (adding seats, upgrading plans, purchasing add-ons) contribute more lifetime value than their initial contract suggests. Products that are designed for collaborative workflows, where value increases as more team members participate, naturally encourage expansion.
How Does Lifetime Value (LTV) Connect to Product Roadmapping?
LTV is often treated as a reporting metric, something calculated after the fact. The more powerful use is as a forward-looking input to roadmap decisions.
Using Lifetime Value (LTV) to Evaluate Roadmap Bets
Every item on a product roadmap represents a bet: an investment of engineering time, design effort, and opportunity cost. LTV provides a way to evaluate those bets in financial terms. A proposed feature that targets a high-LTV segment and addresses a known churn driver is a different kind of bet than one that adds a “nice to have” capability for a segment with low retention.
This connects directly to outcome-based roadmapping. In a Now-Next-Later roadmap, the “Now” column should contain work tied to the highest-confidence, highest-impact outcomes. LTV analysis helps identify which outcomes carry the most weight.
Lifetime Value (LTV) and the Problem with Feature Factories
Teams that operate as feature factories tend to measure success by output: features shipped, tickets closed, velocity maintained. LTV provides a counterweight. If a team ships 50 features in a quarter but LTV stays flat or declines, the output hasn’t translated to value. This is the gap that outcome-based roadmapping exists to close.
ProdPad’s approach to roadmapping emphasizes connecting every roadmap initiative to a strategic outcome, whether that’s reducing churn in a specific segment, increasing activation rates, or expanding revenue from existing accounts. LTV is the metric that ties all of those outcomes together into a single measure of customer-level impact.
LTV improves when roadmap work is tied to clear objectives. ProdPad’s free eBook, The Ultimate Collection of Product OKR Examples, has 25 ready-made OKRs to help you connect product goals to business outcomes.
What is a Good Lifetime Value (LTV)?
There’s no universal benchmark for a “good” LTV because the number varies enormously based on industry, price point, business model, and customer segment. An enterprise SaaS product with $50,000 annual contracts and 95% retention will have a fundamentally different LTV profile than a consumer subscription app charging $10 per month.
Lifetime Value (LTV) Benchmarks in SaaS
The most useful way to evaluate LTV is relative to acquisition cost. The 3:1 LTV:CAC ratio is the standard benchmark in SaaS, as described by investors and operators across the industry. Companies with ratios well above 3:1 may be underinvesting in growth. Companies below that threshold need to investigate whether their churn rates, pricing, or acquisition channels are misaligned.
Beyond the ratio, trends matter more than absolutes. A rising LTV over successive quarterly cohorts signals improving product-market fit, better retention, and stronger customer relationships. A declining LTV, even if the absolute number is still healthy, is a leading indicator that something is breaking.
Lifetime Value (LTV) by Customer Segment
One of the most common mistakes is treating LTV as a single company-wide number. In practice, LTV varies dramatically across customer segments, acquisition channels, plan types, and use cases.
A product team might discover that customers in regulated industries (fintech, healthtech, government) have significantly higher LTV because switching costs are higher and adoption is deeper once the product clears compliance hurdles. Customers acquired through word-of-mouth referrals might have higher LTV than those acquired through paid search, because the referral implies a stronger need and higher intent.
Segmenting LTV this way turns it from a reporting metric into a strategic tool. It informs which segments to prioritize in the roadmap, which acquisition channels to invest in, and where Customer Success should focus retention efforts.
How Can Product Teams Improve Lifetime Value (LTV)?
Improving LTV is a cross-functional effort, but Product teams have outsized influence because they control the experience that determines whether customers stay, grow, or leave.
Reduce Early Churn by Strengthening Onboarding
The highest-leverage intervention for most SaaS products is reducing churn in the first 30 to 90 days. Customers who never reach the activation moment (the point where they experience core product value) rarely become long-term users. Teresa Torres, in her work on continuous discovery habits, emphasizes the importance of understanding what drives customers to adopt and stick with a product. That understanding should inform onboarding flows, in-app guidance, and the sequencing of features a new user encounters.
Tracking product adoption metrics alongside LTV cohort data can reveal where the onboarding experience is losing people. If users who complete a specific onboarding milestone have 3x the LTV of those who don’t, that milestone becomes a product priority.
Build for Retention, Not Just Acquisition
Many product roadmaps are front-loaded with acquisition-focused features: things that look good in demos, generate buzz, or help Sales close deals. Retention-focused investments (performance improvements, workflow refinements, integrations that reduce the need to switch tools) are less glamorous but often more impactful on LTV.
Melissa Perri’s concept of escaping the build trap is relevant here. Teams that build continuously without validating whether their work moves the retention needle are investing resources without returns. Connecting roadmap items to LTV outcomes through an OKR framework forces the team to ask: will this actually keep customers longer or help them grow?
Encourage Expansion Through Product Design
Products that grow with their customers generate higher LTV naturally. This means designing for collaborative use cases, building tiered capabilities that scale with team size, and creating clear value inflection points that make upgrades feel obvious rather than forced.
The AARRR (Pirate Metrics) framework captures this progression through its Revenue stage, which explicitly considers expansion and monetization as part of the product lifecycle. Product teams that instrument their product to track how users progress through these stages can identify where expansion opportunities exist and where friction is blocking them.
Use Customer Feedback to Target High-Impact Improvements
Customer feedback is one of the most underused inputs for improving LTV. Not feedback in the abstract (“customers want feature X”), but feedback connected to churn risk and segment value. When a high-LTV customer segment consistently requests a specific capability, that request carries more strategic weight than a popular feature request from a segment with high churn and low revenue. ProdPad’s approach to feedback management connects customer signals directly to roadmap items, making it possible to see which requests map to the highest-value segments and which are driven by customers who are likely to churn regardless.
Churn is the single biggest drag on Lifetime Value. For a practical breakdown of how Product teams can identify and reduce it, read our guide on churn prevention for Product Managers.
What are Common Mistakes When Using Lifetime Value (LTV)?
LTV is a powerful metric, but it’s also easy to misuse. Several patterns consistently trip up Product and leadership teams.
Treating Lifetime Value (LTV) as a Static Number
LTV changes over time, across cohorts, and across segments. A single company-wide LTV figure, calculated once a year, provides almost no actionable insight. Teams that update LTV monthly by cohort and segment are the ones who can actually use it to drive decisions.
Ignoring the Cost Side of the Equation
Gross LTV (total revenue from a customer) is less useful than net LTV (revenue minus the cost of serving that customer). If a customer pays $10,000 over their lifetime but requires $8,000 in support, onboarding, and infrastructure costs, the real value is $2,000. Product decisions that reduce the cost to serve (through self-service onboarding, better documentation, and more reliable infrastructure) improve net LTV without requiring any change to pricing or retention.
Over-Optimizing for High-LTV Segments at the Expense of Everything Else
There’s a temptation to pour all resources into the highest-LTV segments and ignore everyone else. This can backfire. Today’s low-LTV segment might be tomorrow’s high-growth market. And a product that only serves enterprise customers loses the breadth that drives product-market fit signals and community effects.
Using Lifetime Value (LTV) Projections from Insufficient Data
Early-stage SaaS companies with limited churn data often produce inflated LTV projections because customers haven’t been around long enough to churn at meaningful rates. Using a 12-month lookback window (or even shorter) and being explicit about confidence intervals is more honest than projecting indefinitely into the future with thin data.
How Does Lifetime Value (LTV) Relate to Other Product Metrics?
LTV doesn’t exist in isolation. It connects to a web of related metrics that together give a fuller picture of product health.
Lifetime Value (LTV) and Customer Churn
LTV and customer churn are inversely related. As churn decreases, customer lifetimes extend, and LTV rises. This is why churn prevention is one of the most direct paths to improving LTV. Even small reductions in monthly churn (from 5% to 4%, for instance) compound dramatically over time.
Lifetime Value (LTV) and Net Revenue Retention (NRR)
Net Revenue Retention measures whether existing customers are generating more or less revenue over time, accounting for expansion, contraction, and churn. A company with NRR above 100% is growing revenue from its existing customer base, which directly increases LTV. Products designed to encourage expansion (through seat-based pricing, usage-based tiers, or add-on modules) tend to have both high NRR and high LTV.
Lifetime Value (LTV) and Product-Market Fit
Strong LTV is one of the most reliable signals of product-market fit. If customers stay for years, expand their usage, and generate revenue that far exceeds acquisition costs, the product is solving a real problem for a willing market. Declining LTV across cohorts, conversely, can signal that product-market fit is eroding, perhaps due to competitive pressure, market shifts, or product stagnation.
Lifetime Value (LTV) and the AARRR Framework
Within the AARRR framework, LTV sits at the intersection of Retention and Revenue. It captures whether the product is keeping users engaged (Retention) and whether that engagement translates into financial value (Revenue). Teams using pirate metrics as their operating framework can think of LTV as the compounding outcome of getting the upstream stages right.
LTV connects directly to how you set and track product goals. Our built-in OKR management tool ties objectives to your roadmap, so every initiative is grounded in measurable outcomes.
Where Product Teams Go Wrong with Lifetime Value (LTV)
The biggest failure mode with LTV isn’t miscalculation. It’s isolation. LTV locked inside a finance dashboard, reviewed quarterly, and disconnected from product decisions is LTV wasted.
Product teams that treat LTV as a strategic input make different decisions than those that don’t. They prioritize retention-focused work alongside acquisition-focused features. They evaluate roadmap bets through a financial lens, connecting proposed initiatives to expected changes in churn, expansion, or segment-level revenue. They design onboarding experiences that accelerate time-to-value, because they know the data shows a direct link between activation speed and long-term customer worth.
The organizations that get the most from LTV are the ones where it lives in the product system of record, connected to roadmap items, customer feedback, and strategic goals. When a team can see that a particular cohort of customers has declining LTV and trace that decline to a specific gap in the product experience, the path from insight to action becomes short.
That connection between strategy, evidence, and execution is the core of what outcome-based Product Management looks like in practice. LTV is the metric that makes the outcomes concrete.
Teams that improve LTV fastest are the ones that connect customer feedback directly to their roadmap. Read our guide to building a customer feedback strategy that turns user signals into retention-driving product decisions.
Enjoy a single source of truth for every product idea
Start a free trial and see how easy your Product Management life could be with ProdPad